The Mixed Reality Forums here are no longer being used or maintained.
There are a few other places we would like to direct you to for support, both from Microsoft and from the community.
The first way we want to connect with you is our mixed reality developer program, which you can sign up for at https://aka.ms/IWantMR.
For technical questions, please use Stack Overflow, and tag your questions using either hololens or windows-mixed-reality.
If you want to join in discussions, please do so in the HoloDevelopers Slack, which you can join by going to https://aka.ms/holodevelopers, or in our Microsoft Tech Communities forums at https://techcommunity.microsoft.com/t5/mixed-reality/ct-p/MicrosoftMixedReality.
And always feel free to hit us up on Twitter @MxdRealityDev.
Optimization of performance and project size

Hello, it seems that I have broken my project. The total project size has gotten too large and I can't seem to get it to be smaller.
I duplicated what I knew was an overly heavy scene and added it to the build. (just testing something) Turns out I over did it and it made the whole app very very slow. Every scene was lagging behind and it even crashed when I moved too fast. So I went into the 2 large scenes and deleted the obvious problem elements. This should have had a large impact on the file size. I tested it and it was still extremely slow. So, I removed the extra scene. The file at this point should have been lighter than my original project (which was working fine before) because I had deleted a ton of objects.
Why is my project still having such a hard time? Is there a way to purge or properly clean up the build file? Am I missing a step?
Why doesn't the project get smaller when I remove things?
Thank you in advance for any help and advice!
Cheers
Best Answers
-
Options
 mark_grossnickle
✭✭✭
mark_grossnickle
✭✭✭
Anything in the resources folder will be included in the built project. So removing large items from the scene isn't enough. Remove them from your assets or at the very least move them out of your resources folder and make sure nothing references them. Any item outside of the resources folder that is referenced in one of your scenes will still be included so check references as well.
Taqtile
5 -
Optionsmark_grossnickle
✭✭✭
It could be a variety of things but the main two items to check first are the Profiler and the DrawCalls and Verts.
DrawCalls are found by opening the statistics windows in the editor. It will show them as Batches. I've heard 100 is the cut off but we seem to start seeing issues at much less than a 100. You can see what exactly is causing each draw call by using the Frame Debugger.
Verts is found in the same window. It is determined by the complexity of your model. You'll want this under 100k.
The profiler will help you determine if you are having issues with your code rather than your gpu. Focus on the CPU profiler and once you have located trouble areas enable the deep profiling to really dive into what is going on in those areas.
Let me know if you find anything eye opening there. If not, there could be a couple other things to try but most issues should be visible with those tools.
Taqtile
5
Answers
Anything in the resources folder will be included in the built project. So removing large items from the scene isn't enough. Remove them from your assets or at the very least move them out of your resources folder and make sure nothing references them. Any item outside of the resources folder that is referenced in one of your scenes will still be included so check references as well.
Taqtile
Thank you Mark so much for your response. Since then I have drastically reduced my total file size. Yet I am still having a performance issue in 2 of my 3 scenes. I have replaced all large FBX models with simple ones as well as removing a lot of other things and extra scenes. Total file size went from 3.8Gb to 1.7Gb.
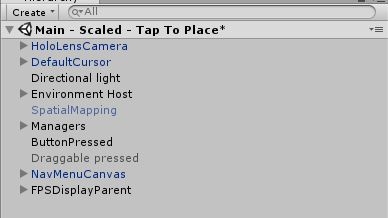
While this did help, I am still getting about 20FPS while looking at a basic FBX that is about 1200Kb total and materials that are just basic colours. Before the performance hit, I had models way larger that were running way better than it is now. This scene is running the worst yet has the least information in it. See the attached image for the small list of things in my scene. The model doesn't update very well when I move around the room. It gets all warped then snaps back into place.
What are other ways to analyse performance and try to narrow down what is causing the drag?
I can see that the cpu usage ranges from about 20-30% (when running well) to 30-40% (When dragging) but I can't tell what is being so difficult to process.
I really appreciate any tips or tricks to help me fix my program. Thank you!
It could be a variety of things but the main two items to check first are the Profiler and the DrawCalls and Verts.
DrawCalls are found by opening the statistics windows in the editor. It will show them as Batches. I've heard 100 is the cut off but we seem to start seeing issues at much less than a 100. You can see what exactly is causing each draw call by using the Frame Debugger.
Verts is found in the same window. It is determined by the complexity of your model. You'll want this under 100k.
The profiler will help you determine if you are having issues with your code rather than your gpu. Focus on the CPU profiler and once you have located trouble areas enable the deep profiling to really dive into what is going on in those areas.
Let me know if you find anything eye opening there. If not, there could be a couple other things to try but most issues should be visible with those tools.
Taqtile